b8: statistical discussion
Index
Why this?
Programming version 0.4 of b8, I decided to make it's probability calculation variable. Because of that, I wondered with which setting one could make b8's performance better. So I started to do some tests to figure out what default values should be set in the config files.
I'm not a statistician – so if you know it better, please tell me ;-) Anyway – if you experience other values to be better as the "best" values I found, please also contact me.
Here's what I found.
Way of proceeding
I took the wordlist from the b8 installation of my homepage that has been filled with 103 ham and 266 spam texts resulting in 2523 ham and 5120 spam tokens (sharing 333). Further, I took a corpus of spam and ham texts collected by Johannes Rosa with the guestbook of http://www.abi2002amschiller.de/ added to the ham corpus.
Those 350 spam and 207 ham texts were rated using the wordlist, being sure that it wasn't built from these texts. In this way, the texts have not been seen by b8, corresponding to real situation.
As done on my homepage, a spam-cutoff value of 0.7 was set to discriminate "ham" from "spam".
Statistical analysis
"Sharp" ratings vs. Gary Robinson's approach
Paul Graham proposes to do a "sharp" rating in [1], using 0.9998 or 0.9999 for tokens only seen in spam texts resp. 0.0002 or 0.0001 for only-ham tokens. This has been b8's default behaviour from version 0.2. Anyway, Gary Robinson's calculation method for the single token ratings proposed in [2] has been used to rate tokens seen in ham and spam from version 0.1.
The first thing to figure out was if this was meaningful. As the wordlist just shared a small amount of tokens between ham and spam, one can assume that Robinson's approach has no big impact on the results using the "traditional" sharp rating method to calculate the texts's probabilities.
First, the whole ham and spam corpus was rated using the wordlist. Then, the false negatives and false positives were counted and the Sensitivity, Specifity, Positive Predictive Value and Negative Predictive Value have been calculated.
No minimum deviation was set, according to the default values used in b8 so far. Using the "sharp" rating, s was set to 1 and 0.5 was used as the default rating for an unknown token.
Comparation of the "sharp" rating method and the continious rating
| Text classifying according to b8's rating | ||||||||||||
| "sharp" rating | s=1 | s=0.9 | s=0.7 | s=0.5 | s=0.3 | s=0.1 | s=0.09 | s=0.07 | s=0.05 | s=0.03 | s=0.01 | |
| Spam | 96.57 | 99.14 | 98.57 | 98.29 | ||||||||
| False negative | 3.43 | 0.86 | 1.43 | 1.71 | ||||||||
| Ham | 100 | 100 | 100 | 100 | ||||||||
| False positive | 0 | 0 | 0 | 0 | ||||||||
| Cross tabulation of the results | ||||||||||||
| "sharp" rating | s=1 | s=0.9 | s=0.7 | s=0.5 | s=0.3 | s=0.1 | s=0.09 | s=0.07 | s=0.05 | s=0.03 | s=0.01 | |
| Sensitivity | 96.57 | 99.14 | 98.57 | 98.29 | ||||||||
| Specifity | 100 | 100 | 100 | 100 | ||||||||
| Positive Predictive Value | 100 | 100 | 100 | 100 | ||||||||
| Negative Predictive Value | 94.52 | 98.57 | 97.64 | 97.18 | ||||||||
So, Robinson's approach seems to deliver the better results, independent of the value for s. Here's a boxplot of all resulting values for the spam and the ham corpus (click to enlarge):
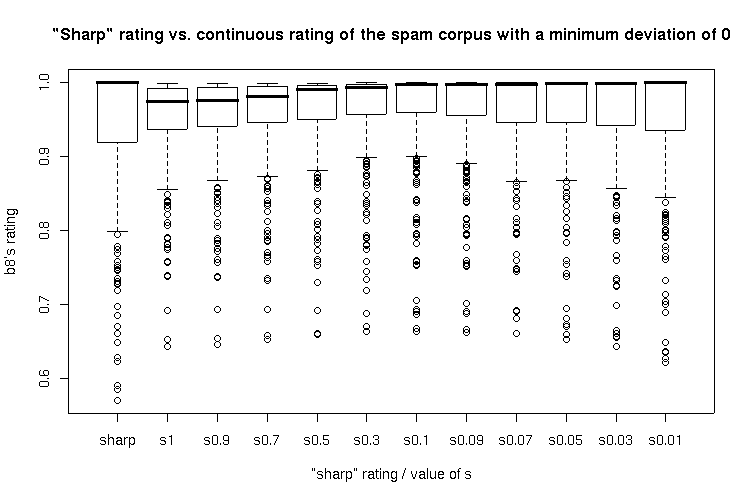
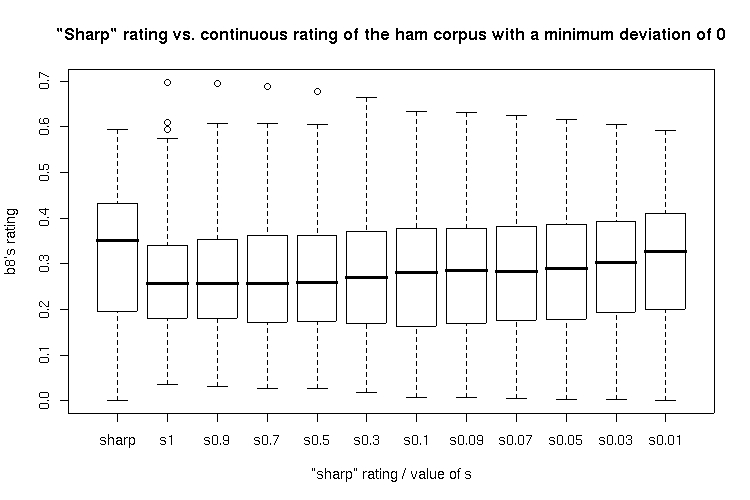
Closer inspection: Two-sided Wilcoxon rank sum test
All ratings using the continious calculation and an s value from 1 to 0.03 showed significantly higher ratings for spam than the traditional "sharp" rating method whereas all continious ratings with s values bigger than 0.03 showed no significanty higher ratings for the ham corpus. None of the methods showed a significantly lower rating for ham than another.
Here we can say that Robinson's approach goes ahead of the method used in b8 up to version 0.3.3, but no significant differences between the continious rating method's results depending from the s value were found. Further tests just using this method showed different behaviour depending on the setting of a minimum deviation anyway.
Using a minimum deviation
Results using a minimum deviation of 0.2
It seems that setting a minimum deviation that a token's rating has to have for the spamminess calculation is meaningful. Setting the minimum deviation to 0.2 even increased the ratio of spam texts detected, with still no false positives:
| Text classifying according to b8's rating | |||||||||||
| s=1 | s=0.9 | s=0.7 | s=0.5 | s=0.3 | s=0.1 | s=0.09 | s=0.07 | s=0.05 | s=0.03 | s=0.01 | |
| Spam | 99.14 | 99.43 | 99.43 | 98.86 | 98.57 | 98.29 | |||||
| False negative | 0.86 | 0.57 | 0.57 | 1.14 | 1.43 | 1.71 | |||||
| Ham | 99.52 | 99.52 | 100 | 100 | 100 | 100 | |||||
| False positive | 0.48 | 0.48 | 0 | 0 | 0 | 0 | |||||
| Cross tabulation of the results | |||||||||||
| s=1 | s=0.9 | s=0.7 | s=0.5 | s=0.3 | s=0.1 | s=0.09 | s=0.07 | s=0.05 | s=0.03 | s=0.01 | |
| Sensitivity | 99.14 | 99.43 | 99.43 | 98.86 | 98.57 | 98.29 | |||||
| Specifity | 99.52 | 99.52 | 100 | 100 | 100 | 100 | |||||
| Positive Predictive Value | 99.71 | 99.71 | 100 | 100 | 100 | 100 | |||||
| Negative Predictive Value | 98.56 | 99.04 | 99.04 | 98.1 | 97.64 | 97.18 | |||||
Results using a minimum deviation of 0.4
Setting the minimum deviation to 0.4, b8's Sensitivity increased even more, but at the cost of false positives in each case (except s=0.3, which should be coincidence very likely). So, I consider setting such a high minimum deviation as not acceptable, as false positives are considerably less tolerable than false negatives.
| Text classifying according to b8's rating | |||||||||||
| s=1 | s=0.9 | s=0.7 | s=0.5 | s=0.3 | s=0.1 | s=0.09 | s=0.07 | s=0.05 | s=0.03 | s=0.01 | |
| Spam | 99.14 | 99.43 | 99.14 | 100 | 98.57 | 98.29 | 98 | ||||
| False negative | 0.86 | 0.57 | 0.86 | 0 | 1.43 | 1.71 | 2 | ||||
| Ham | 98.07 | 97.58 | 97.58 | 98.07 | 99.52 | 99.52 | 99.52 | ||||
| False positive | 1.93 | 2.42 | 2.42 | 1.93 | 0.48 | 0.48 | 0.48 | ||||
| Cross tabulation of the results | |||||||||||
| s=1 | s=0.9 | s=0.7 | s=0.5 | s=0.3 | s=0.1 | s=0.09 | s=0.07 | s=0.05 | s=0.03 | s=0.01 | |
| Sensitivity | 99.14 | 99.43 | 99.14 | 100 | 98.57 | 98.29 | 98 | ||||
| Specifity | 98.07 | 97.58 | 97.58 | 98.07 | 99.52 | 99.52 | 99.52 | ||||
| Positive Predictive Value | 98.86 | 98.58 | 98.58 | 98.87 | 99.71 | 99.71 | 99.71 | ||||
| Negative Predictive Value | 98.54 | 99.02 | 98.54 | 100 | 97.63 | 97.17 | 96.71 | ||||
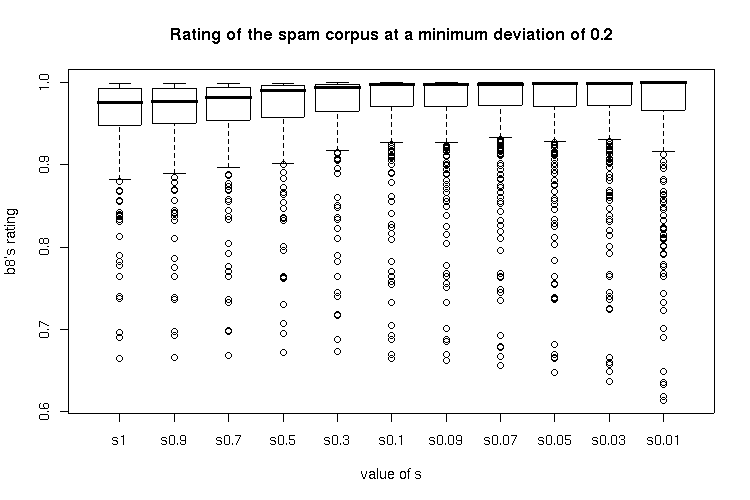
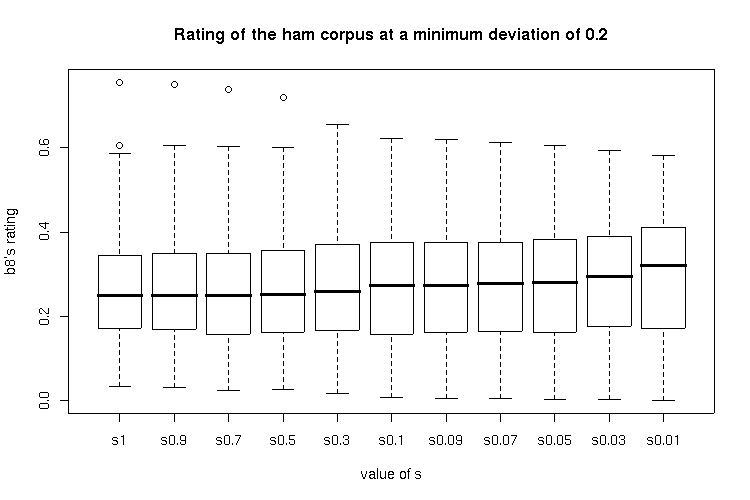
Visualization of the data
The below boxplots show the ratings of the spam and the ham corpus at a specific s value dependent of the minimum deviation used.
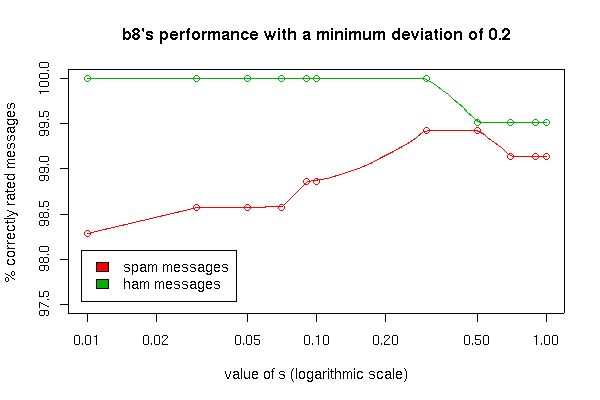
Results for a minimum deviation of 0.2
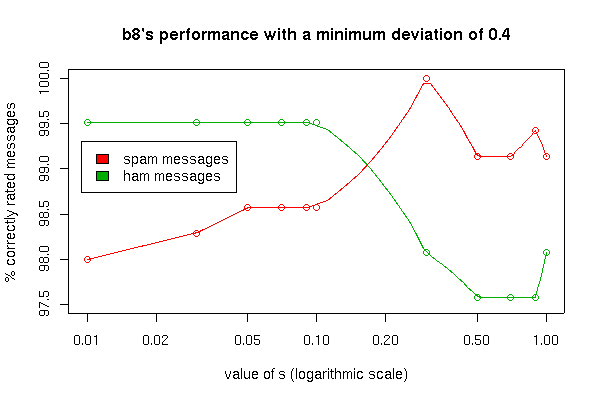
Results for a minimum deviation of 0.4
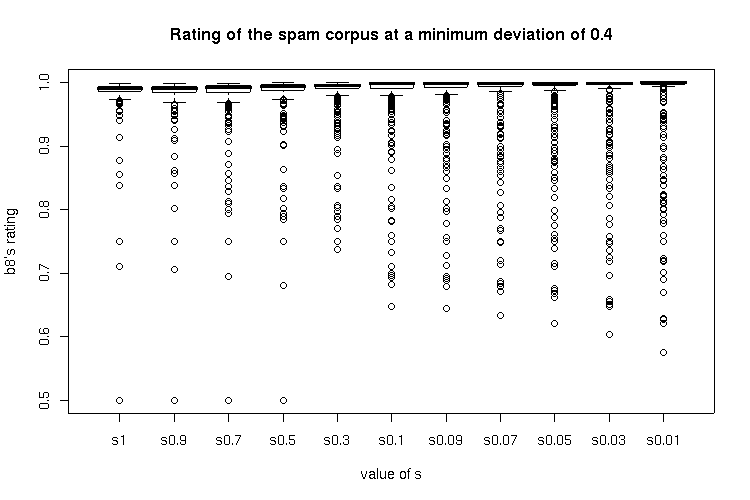

The situation is the same as with the ratings where no minimum deviation was used: very small s values (0.03 and 0.01) showed a significantly higher rating for the ham corpus with no significant difference to greater s values in the rating of the spam corpus.
The minimum deviation 0.4 ratings show a step in ham ratings between s=0.5 and s=0.3 with a quite low median of the ham rating before, but this setting is not acceptable due to the occurence of false positives.
The ratings using a minimum deviation of 0.4 apparenty produce a tighter box, but no significant differences between the distribution of the ratings using a minimum deviation of 0.4 have been found (probably due to more outliners).
Overview of b8's performance
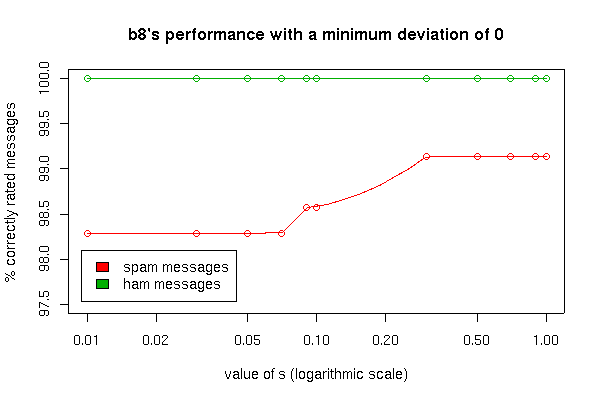
The following pictures visualize the rate of correctly rated texts depending on the s value used and the minimum deviation set.
Comparing b8's performance using a minimum deviation of 0 and 0.2. Both settings show the best performance with a s value of 0.3. Using 0.2 as the minimum deviation increases the identified spam messages with still no false positives.
Using the higher 0.4 minimum deviation results in the occurance of false positives independent of the s value but a sensitivity not increased much nevertheless:
Inspection of the median and mean ratings
The following pictures illustrate the median (drawn through) and mean (dashed) ratings of b8 depending on the s and minimum deviation setting, separate for the spam and the ham corpus.


Apart from the step in the ham rating between s=0.5 and s=0.3 using a minimum deviation of 0.4 described above, the ham rating seems to be quite constant with few outliners (as the median and mean values are resemblant) independent of the settings used. So should be b8's performance to identify ham texts.
The median value of the spam ratings seems to be quite constant with an s value less than 0.5 used. The mean rating has a maximum at 0.3, as assumed. The higher the minimum deviation is set, the higher get the mean values meaning that more outliners are catched.
Conclusions
- Gary Robinson's approach to calculate the single probabilities of tokens is significantly better than Paul Graham's "sharp" rating method. It will not be used in b8 any longer.
- A minimum deviation chosen too great results in false positives.
- b8's performance to identify ham texts correctly seems to be quite constant, relatively independent of the settings used with a better rate for values of s of about 1 (and a not too great minimum deviation).
- b8's performance to catch spam texts rises with a minimum deviation that a token's rating has to have to be used with a maximum performance at s values around 0.3 (where the ham ratings are still quite low!).
So, I think not using the "sharp" ratings, setting s to 0.3 and minDev to 0.2 will cause quite good results :-) Let me know if you know it better and have a lot of fun using b8!
References
http://nasauber.de/